| Air |
| WATER |
|
| SOLID WASTE |
| AGRICULTURE |
|
| CLIMATE |
| DEMOGRAPHY |
| BIODIVERSITY |
|
|
|
 |
| Save Ganga Save Dolphin |
|
| Background and Availability of Water Resources |
|
Ganga and Gandak are perennial rivers flow through the state. In addition Sone, Ghaghraand ---------- are seasonal rivers and are tributaries of Ganga.These have a water potential of about ---------.the state has a network of canals of length------km and drains of length -------km. The total surface and ground water resources in the state are estimated to be about-----------.Water resources in the state are being used mainly for industrial, irrigation and drinking purposes.The ground water is also a major resource of drinking water. With respect to quality of surface & ground water,theyare affected by following ways:
 |
Direct Point Sources: Discharge of Industrial waste, Domestic waste/Municipal waste and refuse. |
|
Agricultural Sources: Run off and soil erosion from agricultural lands carrying chemical fertilizers, herbicides and pesticides. and |
|
Activities potential to pollution: The use of ground water in excess of recharge is leading to a fall in water table. This should be consider on priority basis, since this is the cause of arsenic water pollution in some districts of the state due to decay of underground minerals. |
Rapid increase of population, urbanization, agricultural practices and several human activities are polluting the fresh water resource in the state by adding a lots of pollutants. This resulted in the increase of water pollution. In order to prevent control and abate water pollution, the Water (Prevention and Control of Pollution) Act was enacted in 1974. According to Section 2(e) of Water (Prevention and control of pollution) Act, 1974'water pollution 'means such contamination of water or such alteration of the physical, chemical or biological properties of water or such discharge of any sewage or trade effluent or of any other liquid, gaseous or solid substance into water(whether directly or indirectly) as may, or is likely to, create a nuisance or render such water harmful or injurious to public health or safety, or to the life and health of animals or plants or of aquatic organisms. To ensure that the water quality is being maintained or restored at desired level it is important that it is monitored on regular basis. Water quality monitoring helps in evaluating the nature and extent of pollution control required and effectiveness of pollution control measures already in existence. It also helps in drawing the water quality trends and prioritizing pollution control efforts. It is one of the primary goals of the Water Act to protect our valuable water resources.
| View the Water Quality Standards |
|
| STANDARDS FOR SURFACE WATER |
|
The following surface water quality standards formulated by the central govt.:
|
Surface Water Quality Standards (as per IS: 2296) |
|
Surface Water Quality Standard(By CPCB) |
|
Water Quality Standards for Coastal Waters Marine Outfalls[By MoEF under The E(P)Rules,1986] |
|
Primary Water Quality Criteria for Bathing Water[By MoEF under The E(P)Rules,1986] |
| Surface Water Quality Standards Formulated by BIS(as per IS:2296) |
This standard has been withdrawn by the Bureau of Indian Standard and it is not valid standard now, as reported by BIS,Patna.
| Surface Water Quality Standards Formulated by CPCB |
| Class of Water |
Designated-Best-Use Classification |
Parameters Affecting |
Quality Criteria |
| A |
Drinking Water Source without conventional treatment but after disinfection |
1. DO |
≥ 6 mg/l |
| 2. BOD(5days 200C) |
≤ 2 mg/l |
| 3. Total Coliform Organism MPN/100 ml |
≤ 50 |
| 4. pH |
Between 6.5 and 8.5 |
| 5. Total Dissolved Solids |
≤ 500 mg/l |
| 6. Chlorides (as Cl) |
≤ 250 mg/l |
| 7. Colour, Hazen Units |
≤ 10 |
| 8. Taste or Odour |
Not perceptible |
| 9. Sodium Absorption Ratio |
-- |
| 10. Boron (as B) |
-- |
| 11.Sulphates (as SO4) |
≤400 mg/l |
| B |
Outdoor Bathing(Organised) |
1. DO |
≥ 5 mg/l |
| 2. BOD(5days 200C) |
≤ 3mg/l |
| 3. Total Coliform Organism MPN/100 ml |
≤ 500 |
| 4. pH |
Between 6.5 and 8.5 |
| 5. Total Dissolved Solids |
-- |
| 6. Chlorides (as Cl) |
-- |
| 7. Colour, Hazen Units |
≤ 300 |
| 8. Taste or Odour |
-- |
| 9. Sodium Absorption Ratio |
-- |
| 10. Boron (as B) |
-- |
| 11.Sulphates (as SO4) |
-- |
| C |
Drinking Water Source after conventional treatment and disinfection |
1. DO |
≥ 4 mg/l |
| 2. BOD(5days 200C) |
≤ 3mg/l |
| 3. Total Coliform Organism MPN/100 ml |
≤ 5000 |
| 4. pH |
Between 6 and 9 |
| 5. Total Dissolved Solids |
≤ 1500 mg/l |
| 6. Chlorides (as Cl) |
≤ 600 mg/l |
| 7. Colour, Hazen Units |
≤ 300 |
| 8. Taste or Odour |
-- |
| 9. Sodium Absorption Ratio |
-- |
| 10. Boron (as B) |
-- |
| 11.Sulphates (as SO4) |
≤400 mg/l |
| D |
Propagation of Wild Life and Fisheries |
1. DO |
≥ 4 mg/l |
| 2. BOD(5days 200C) |
-- |
| 3. Total Coliform Organism MPN/100 ml |
-- |
| 4. pH |
Between 6.0 and 8.5 |
| 5. Total Dissolved Solids |
-- |
| 6. Chlorides (as Cl) |
-- |
| 7. Colour, Hazen Units |
-- |
| 8. Taste or Odour |
-- |
| 9. Sodium Absorption Ratio |
-- |
| 10. Boron (as B) |
-- |
| 11.Sulphates (as SO4) |
-- |
| 12.Free Ammonia(asN)at 250C |
≤ 1.2 mg/l |
| 13.Electrical Conductivity at 250C |
≤ 2250 micro mhos/cm |
| E |
Irrigation, Industrial Cooling and Controlled waste disposal |
1. Sodium Absorption Ratio |
≤ 26 |
| 2. Boron (as B) |
≤ 2 mg/l |
| Below E |
Not Meeting A,B,C,D& E criteria. |
| Water Quality Standards for Coastal Waters Marine Outfalls[By MoEF under The E(P)Rules,1986] |
No coastal water marine outfalls are available in the state Bihar,therefore this surface water quality standard is irrelevant,here.
| Primary Water Quality Criteria for Bathing Water [By MoEF under The E(P)Rules,1986] |
In a water body or its part, water is subjected to several types of uses. Depending on the types of uses and activities, water quality criteria have been specified to determine its suitability for a particular purpose. Among the various types of users there is one use that demands highest level of water quality or purity and that is termed as "Designated Best Use" in that stretch of water body. Based on this, water quality requirements have been specified for different uses in terms of primary water quality criteria. The primary water quality criteria for bathing water are specified along with the rational in Table below:
(Water used for organised outdoor bathing)
| Criteria |
Rationale |
1.Fecal Coliform 500 (desirable)
MPN/100ml: 2500 (Maximum Permissible) 2.Fecal Streptococci 100 (desirable)
MPN/100 ml: 2500 (Maximum Permissible) |
To ensure low sewage contamination Fecal coliform and fecal streptococci are considered as they reflect the bacterial pathogen city.
The desirable and permissible limits are suggested to allow foe fluctuation in environmental conditions such as seasonal change, changes in flow conditions etc. |
2.pH: Between 6.5 - 8.5 |
The range provides protection to the skin and delicate organs like eyes, nose, ears etc. which are directly exposed during outdoor bathing. |
| 3.Dissolved Oxygen: 5 mg/1 or more |
The minimum dissolved oxygen concentration of 5 mg/1 ensure reasonable freedom from oxygen consuming organic pollution immediately upstream which is necessary for preventing production of anaerobic gases (obnoxious gases) from sediment. |
4.Biochemical Oxygen 3 mg/1 or less
Demand 3 day, 270C |
The Biochemical Oxygen Demand of 3 mg/1 or less of the water ensures reasonable freedom from oxygen demanding pollutants and prevent production of obnoxious gases.] |
| STANDARDS FOR GROUND WATER QUALITY |
|
(Source:STATUS OF GROUNDWATER QUALITY IN INDIA -Part – I byCPCB)
Since all groundwater resources of the State are classified for more than one use and therefore, the most stringent or protective criteria will be applicable. Therefore, its qualities have been compared with Bureau of Indian standards: IS :10500:1991 and WHO Guideline for Groundwater Sources for Drinking Water which is presented in the form of Table given below:
Indian Standards for Drinking Water-Specification
BIS:IS 10500:1991,Reaffirmed: 1993) & WHO Guidelines for Drinking Water |
| Sl No |
Substance or characteristics/Parameter |
BIS,Indian Standards(IS 10500:1991) |
World Health Organization(WHO Guidelines) |
| Desirable Limit |
Permissible Limitin the
absence of Alternate
Source |
Maximum allowable concentration |
| (1) |
(2) |
(3) |
(4) |
(5) |
| Essential Characteristics |
| 1 |
ColourHazen Units, Max |
5 |
25 |
15 True colour units |
| 2 |
Odour |
Unobjectionable |
--- |
-- |
| 3 |
Taste |
Agreeable |
--- |
-- |
| 4 |
Turbidity, NTU, Max |
5 |
10 |
5.0 NTU |
| 5 |
pH value |
6.5 to 8.5 |
No relaxations |
6.5 to 8.5 |
| 6 |
Total hardness (as CaCO2) mg/L, Max |
300 |
600 |
500 mg/L |
| 7 |
Iron (as Fe) mg/L, Max |
0.3 |
1.0 |
0.3 mg/L |
| 8 |
Chlorides (as Cl) mg/L , Max |
250 |
1000 |
250 mg/L |
| 9 |
Residual, free chlorine(when protection against viral infection is required it should be Min 0.5 mg/L), mg/L, Min |
0.2 |
--- |
-- |
| Desirable characteristics |
| 10 |
Dissolved solids mg/L, Max |
500 |
2000 |
1000 mg/L |
| 11 |
Calcium (as Ca) mg/L, Max |
75 |
200 |
-- |
| 12 |
Copper (as Cu) mg/L, Max |
0.05 |
1.5 |
1.0 mg/L |
| 13 |
Magnesium(as Mg),mg/L,Max |
30 |
100 |
-- |
| 14 |
Manganese (as Me) mg/L, Max |
0.1 |
0.3 |
0.1 mg/L |
| 15 |
Sulphate (as SO4) mg/L, Max |
200 |
400 |
400 mg/L |
| 16 |
Nitrate (as NO3) mg/L, Max |
45 |
No relaxation |
10 mg/L |
| 17 |
Fluoride (as F) mg/L, Max |
1.0 |
1.5 |
1.5 mg/L |
| 18 |
Phenolic compounds (asC6H5OH) mg/L, Max |
0.001 |
0.002 |
-- |
| 19 |
Mercury (as Hg) mg/L, Max |
0.001 |
No relaxation |
0.001 mg/L |
| 20 |
Cadmium (as Cd), mg/L, Max |
0.01 |
No relaxation |
0.005 mg/L |
| 21 |
Selenium (as Se), mg/L, Max |
0.01 |
No relaxation |
0.01 mg/L |
| 22 |
Arsenic (as As) mg/L, Max |
0.05 |
No relaxation |
0.05 mg/L |
| 23 |
Cyanide (as CN), mg/L, Max |
0.01 |
No relaxation |
0.1 mg/L |
| 24 |
Lead (as Pb), mg/L, Max |
0.05 |
No relaxation |
0.05 mg/L |
| 25 |
Zinc (as Zn), mg/L, Max |
5 |
15 |
5.0 mg/L |
| 26 |
Amonic detergents (as MBAS) mg/L, Max |
0.2 |
10 |
-- |
| 27 |
Chromium (as Cr6+) mg/L, Max |
0.05 |
No relaxation |
0.05 mg/L |
| 28 |
Polynuclear aromatic hydrocarbons (as PAH) g/L, Max |
--- |
--- |
|
| 29 |
Mineral oil mg/L, Max |
0.01 |
0.03 |
-- |
| 30 |
Pesticides mg/L, Max |
A bsent |
0.001 |
-- |
| 31 |
Radioactive Materials:
a) Alpha emitters Bq/L, Max
b) Beta emitterspci/L, Max |
---
--- |
0.1
1 |
-- |
| 32 |
Alkalinity mg/L, Max |
200 |
600 |
-- |
| 33 |
Aluminum (as Al), mg/L, Max |
0.03 |
0.2 |
0.2 mg/L |
| 34 |
Boron, mg/L, Max |
1 |
5 |
-- |
| Sl. No. |
Parameter |
BIS,Indian Standards(IS 10500 : 1991) |
World Health Organization,(WHO Guidelines) |
| Desirable Limit |
Permissible Limit |
Maximum allowable concentration |
| 1 |
Sodium |
- |
- |
200 mg/L |
| 2 |
Aldrin&dieldrin |
- |
- |
0.03 μg/L |
| 3 |
DDT |
- |
- |
1.0 μg/L |
| 4 |
Lindane |
- |
- |
3.0 μg/L |
| 5 |
Methoxychlor |
- |
- |
30.0 μg/L |
| 6 |
Benzene |
- |
- |
10.0 μg/L |
| 7 |
Hexachlorobenzene |
- |
- |
0.01 μg/L |
| 8 |
Pentachlorophenol |
- |
- |
10.0 μg/L |
(Source-GROUNDWATER QUALITY SERIES: GWQS/ 09/2006-2007 by CPCB)
| Water Quality Monitoring Network |
|
Water quality of river Ganga and its tributaries, Lakes and Ponds in Bihar is being monitored by the State Pollution Control Board.The ground water quality of the state is also monitored by the Board. Water quality monitoring programme was started with only six stations earlier, which was extended and now it is being carried out at 86 monitoring stationsin the state under National Water Quality Monitoring Programme(NWMP) sponsored by CPCB.The present network comprises of 13 stations on main river stream,25 on tributaries of river Ganga,03 on Lakes & Ponds water bodies and 45 on groundwater bodies.
The number of sampling locations on mainstream of the majorrivers and their tributaries, medium and minor rivers, lakes, ponds water bodies are given in parenthesis.
Water Body wise Distribution of Monitoring Stations with No of
locations ,Sampling Frequency, Protocol for Parameters & Parameters Analyses |
Monitoring Stations on Ganga River Stream
| Sl No |
Monitoring Station |
No of locations |
Sampling
Frequency |
Monitoring Protocol for Parameters |
Parameters Analyses |
| 1 |
1.Chusa 2.Ramrekha,Dist-Buxar |
2 |
Monthly |
Core Parameters
Temp.,PH,Conductivity,DO,BOD, Nitrate-N, Ammonia -N,TotalColiforms,Fecal Coliforms. General Parameters
COD, TKN, Dissolved Solids, Total Fixed Solids, Total Suspended Solids, Turbidity, Hardness, Fluoride,Boron, chloride,Sulphate, Total Alkalinity, P-Alkalinity, Phosphate, Sodium, Potassium, Calcium, Magnesium. Trace Metal
Arsenic, Nickel, Copper, Mercury, Chromium Zinc, Lead & Iron. Pesticides
Alpha BHC, Beta BHC, Gama BHC(Lindance), OP-DDT, PP-DDT, Alpha Endosulphan, Beta EndosulphanDieldrin, Carbqnyl (Carbamate) 2, 4D, Aldrin, Malathian, Methyl Parathian, Anilophos, Chloropyriphos. |
Temp.,PH,,DO,BOD,TotalColiforms,Fecal Coliforms |
| 2 |
Doriganj, Chhapra,Dist- Saran |
1 |
Monthly |
| 3 |
Kurji, Darbhanga Ghat, Gaigh at Fatuha and U/s & D/s Mokama, Dist-Patna |
6 |
Monthly |
| 4 |
KilaGhat, Dist-Munger |
1 |
Monthly |
| 5 |
Ajgaibinath Ghat, (Sultanganj), BarariGhat (Bhagalpur), JahazGhat (Kahalgaon), Dist- Bhagalpur |
3 |
Monthly |
| |
Total |
13 |
|
Monitoring Stations on Tributaries of Ganga River
| Sl No |
Tributaries |
Monitoring Station |
No of locations |
Sampling
Frequency |
Monitoring Protocol for Parameters |
Parameters Analyses |
| 1 |
Sone |
Indrapuri(Dehari-on-Sone) and Koelwar(Arrah) |
2 |
Monthly |
Core Parameters
Temp.,PH,Conductivity,DO,BOD,Nitrate-N,Ammonia-N,Total Coliforms,Fecal Coliforms. General Parameters
COD, TKN, Dissolved Solids, Total Fixed Solids, Total Suspended Solids, Turbidity, Hardness, Fluoride Boron, chloride Sulphate, Total Alkalinity, P-Alkalinity, Phosphate, Sodium, Potassium, Calcium, Magnesium. Trace Metal
Arsenic, Nickel, Copper, Mercury, Chromium Zinc, Lead & Iron. Pesticides
Alpha BHC, Beta, BHC, Gama BHC(Lindance), OP-DDT, PPTDDT, Alpha Endosulphan, Beta EndosulphanDieldrin, Carbqryl (Carbamate), 2, 4D, Aldrin, Malathian, Methyl Parathian, Anilophos, Chloropyriphos |
Temp., PH,,DO,BOD, TotalColiforms, Fecal Coliforms |
| 2 |
Ghaghara |
Revilganj(Chapra) |
1 |
Monthly |
| 3 |
Gandak |
Sonepur(Saran) and Rewaghat |
2 |
Monthly |
| 4 |
Punpun |
Fatuha(Patna) |
1 |
Monthly |
| 5 |
Sikhrahna |
Chanpatia and Lal Parsa |
2 |
Quarterly |
| 6 |
Daha |
Siwan, Sasamusa and Utwa bridge |
3 |
Quarterly |
| 7 |
Sirsia |
Raxaul(E.Champaran) |
1 |
Quarterly |
| 8 |
Dhons |
Saharghat (Madhubani) |
1 |
Quarterly |
| 9 |
Parmar |
Jogbani |
1 |
Quarterly |
| 10 |
Harbaura |
Narkatiaganj(W.Champaran) |
1 |
Quarterly |
| 11 |
Ramrekha |
Harinagar(W.Champ.) |
1 |
Quarterly |
| 12 |
BudhiGandak |
Muzaffarpur and Samstipur |
2 |
Quarterly |
| 13 |
Manusmar |
Riga(Sitamarhi) |
1 |
Quarterly |
| 14 |
Koshi |
Kurshailabridge, Medhepura |
2 |
Quarterly |
| 15 |
Kamla |
Benipatti (Madhubani) and Goshalaghat (Darbhanga) |
2 |
Quarterly |
| 16 |
Mahananda |
Thakurganj-Kishanganj Road |
1 |
Quarterly |
| |
Total |
24 |
|
Monitoring Stations on Lakes & Ponds Water Bodies
| Sl No |
Lakes & Ponds |
Monitoring Station |
No of locations |
Sampling
Frequency |
Monitoring Protocol for Parameters |
Parameters Analyses |
| 1 |
Mothijheel Lake |
Motihari |
1 |
Quarterly |
Core Parameters
Temp.,PH,Conductivity,DO,BOD,Nitrate-N,Ammonia-N,TotalColiforms,Fecal Coliforms. General Parameters
COD, TKN, Dissolved Solids, Total Fixed Solids, Total Suspended Solids, Turbidity, Hardness, Fluoride Boron, chloride Sulphate, Total Alkalinity, P-Alkalinity, Phosphate, Sodium, Potassium, Calcium, Magnesium. Trace Metal
Arsenic, Nickel, Copper, Mercury, Chromium Zinc, Lead & Iron. Pesticides
Alpha BHC, Beta, BHC, Gama BHC(Lindance), OP-DDT, PPTDDT, Alpha Endosulphan, Beta EndosulphanDieldrin, Carbqryl (Carbamate), 2, 4D, Aldrin, Malathian, Methyl Parathian, Anilophos, Chloropyriphos |
PH,, DO, BOD, Total Coliforms, Fecal Coliforms |
| 2 |
Kanwar Lake |
Majhaul (Begusarai) |
1 |
Quarterly |
| 3 |
DighiTalab |
Gaya |
1 |
Quarterly |
| 4 |
Suraj Kund |
Gaya |
1 |
Quarterly |
| Total |
4 |
|
Ground Water Quality Monitoring Stations
| Sl No |
Sampling Station |
Sampling
Frequency |
Monitoring Protocol for Parameters |
Parameters Analyses |
| 1. |
Bore Well, katra Bazar, Malsalami, Patna City |
Half Yearly |
Core Parameters
Temp.,PH,Conductivity,DO,BOD,Nitrate-N, Ammonia-N,TotalColiforms,Fecal Coliforms. General Parameters
COD, TKN, Dissolved Solids, Total Fixed Solids, Total Suspended Solids, Turbidity, Hardness, Fluoride Boron, chloride Sulphate, Total Alkalinity, P-Alkalinity, Phosphate, Sodium, Potassium, Calcium, Magnesium. Trace Metal
Arsenic, Nickel, Copper, Mercury, Chromium Zinc, Lead Iron. Pesticides
Alpha BHC, Beta, BHC, Gama BHC(Lindance), OP-DDT, PPTDDT, Alpha Endosulphan, Beta EndosulphanDieldrin, Carbqryl (Carbamate), 2, 4D, Aldrin, Malathian, Methyl Parathian, Anilophos, Chloropyriphos |
PH,Conductivity,NO3(as N),COD,TDS,TFC,Total P,Na,K,T.H,Ca,Mg,Cl,Alkn,SO4,F,B, Total Coliforms, Fecal Coliforms |
| 2. |
Bore Well, Bhuthnath Road Kankarbagh, Patna |
Half Yearly |
| 3. |
Bore Well, Campus of PMCH, Patna |
Half Yearly |
| 4. |
Bore Well, Campus of Water Board Head Office, Patna |
Half Yearly |
| 5. |
Bore Well, I.G.I.M.S. Campus, Patna |
Half Yearly |
| 6. |
Bore Well, Sadar Hospital Campus, Muzaffarpur |
Half Yearly |
| 7. |
Bore Well, Brahampura Naka, Muzaffarpur |
Half Yearly |
| 8. |
Tap Water, Campus of Kali Asthan, Begusarai |
Half Yearly |
| 9. |
Tap Water, Campus of S.P. Office Pokharia, Begusarai |
Half Yearly |
| 10. |
Hand Pump, Govt. Hospital Purnea |
Half Yearly |
| 11. |
Hand Pump, Near Lower Court Purnea |
Half Yearly |
| 12. |
Hand Pump, Bus stand, Tilkamanjhi Chawk, Bhagalpur |
Half Yearly |
| 13. |
Tap Water, Railway Station, Bhagalpur |
Half Yearly |
| 14. |
Tap Water, Veer Kuwar Singh Chawk, Bhagalpur |
Half Yearly |
| 15. |
Hand Pump, Campus of Kasturba Water Works, Munger |
Half Yearly |
| 16. |
Tap Water, PHED Pump house, Main Road, Motihari |
Half Yearly |
| 17. |
Tube Well, T- Model Inter School, Gaya |
Half Yearly |
| 18. |
Bore Well, Dandibagh Water Works, Gaya |
Half Yearly |
| 19. |
Tap Water, Bus Stand, Rajgir |
Half Yearly |
| 20. |
Bore Well, Commissioner's Office Campus, Chapra |
Half Yearly |
| 21. |
Hand Pump, Civil Court, Aurangabad |
Half Yearly |
| 22. |
Hand Pump, Court Compund, Arraria |
Half Yearly |
| 23. |
Hand Pump, Arra Bus Stand, Bhojpur |
Half Yearly |
| 24. |
Tube Well, Collectriate Campus, Buxar |
Half Yearly |
| 25. |
Hand Pump, Nagar Parishad Office, Bhabhua |
Half Yearly |
| 26. |
Hand Pump, Kilagate Near Rambagh, Darbhanga |
Half Yearly |
| 27. |
Hand Pump, Darbhanga Bus Stand |
Half Yearly |
| 28. |
Hand Pump, Bus Stand Gopalganj |
Half Yearly |
| 29. |
Tap Water, Thaway Mandir, Gopalganj |
Half Yearly |
| 30. |
Tap Water, Tank Near, Jahanabad Court |
Half Yearly |
| 31. |
Hand Pump Water, Court Compound, Katihar |
Half Yearly |
| 32. |
Hand Pump, Sadar Hospital, Khagaria |
Half Yearly |
| 33. |
Hand Pump, D.M. Office, Kishanganj |
Half Yearly |
| 34. |
Hand Pump, D.M. Office, Madhepura |
Half Yearly |
| 35. |
Hand Pump, Callectriate Campus, Madhubani |
Half Yearly |
| 36. |
Tap Water, Campus of Tourist Cafeteria, Nalanda |
Half Yearly |
| 37. |
Hand Pamp, Civil Court, Biharsarif, Nalanda |
Half Yearly |
| 38. |
Hand Pamp, Callectriate Campus, Nawada |
Half Yearly |
| 39. |
Hand Pamp, Sadar Hospital, Saharsa |
Half Yearly |
| 40. |
Hand Pamp, Callectriate Campus, Samastipur |
Half Yearly |
| 41. |
Bore Well, Sri Janki Mandir, Sitamarhi |
Half Yearly |
| 42. |
Bore Well, Callectriate Campus, Siwan |
Half Yearly |
| 43. |
Tap Water, Dharmshala, Sasaram, Rohtas |
Half Yearly |
| 44. |
Hand Pump, Bus Stand Sasaram, Rohtas |
Half Yearly |
| 45. |
Tap Water, Railway Station Hazipur, Vaishali |
Half Yearly |
(Source:BSPCB)
| Water Quality Monitoring Network |
|
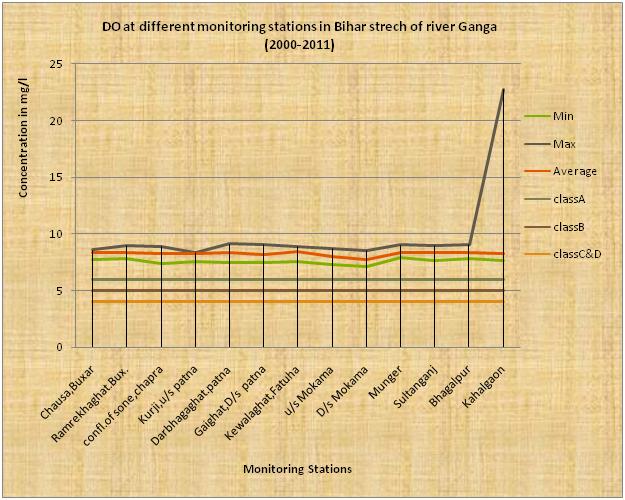
Water samples are being analysed for core parameters,mainly consisting of physico-chemical and bacteriological parameters like: pH, BOD, DO, Total Coliform and Fecal Coliform because of limited resources by the State Pollution Control Board. No General Parameters, Trace Metals & Pesticides parameters are being monitored. These monitoring works are being carried out under MINARS project sponsored by CPCB.
Trend of DO
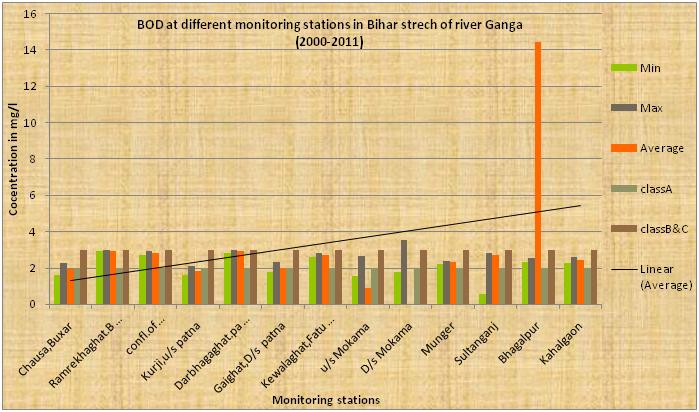
Trend of BOD
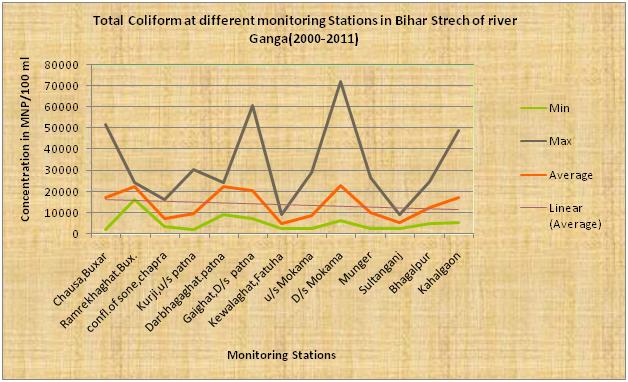
Trend of Total Coliform
Trend of Fecal Coliform

The above diagram indicates that the average dissolve oxygen(DO) of the river Ganga in Bihar stretch is more than 6 mg/l and its DO content is fairly good & meet to DO parameter of class A. pH is vary between max to min . It is clear from the above diagram that there is an increasing trend of average BOD from the location when it enters Bihar at Buxar to down stream last point at Kahalgaon from where it leaves the state. This indicates that there is a gradual addition of organic pollution to water course. This is mainly because of sewage discharged from various towns situated on catchment area of the river as well as agricultural surface run-off water meeting to the river course.
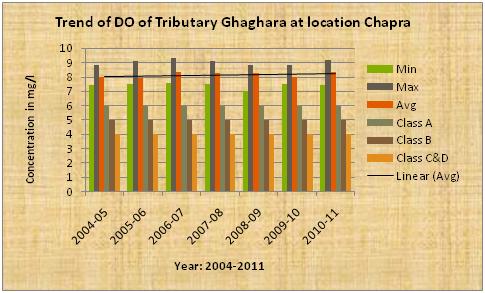
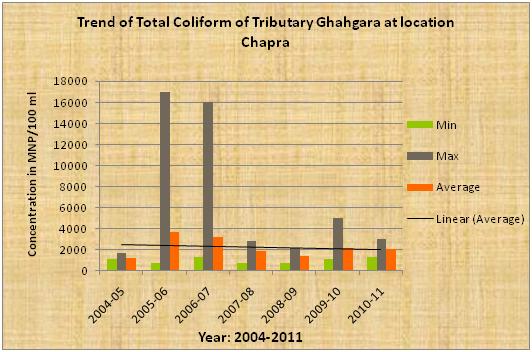
| Ghaghara the tributary of Ganga |
Trend of DO
Trend OF BOD
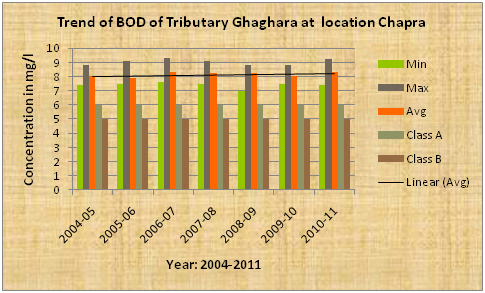
Trend Total Coliform
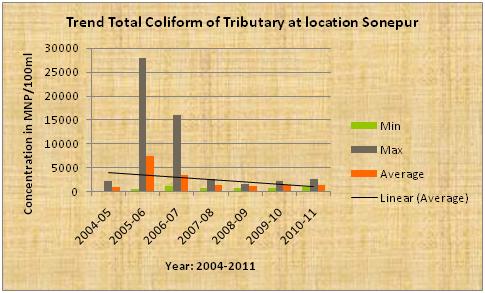
| Gandak the tributary of Ganga |
Trend of DO
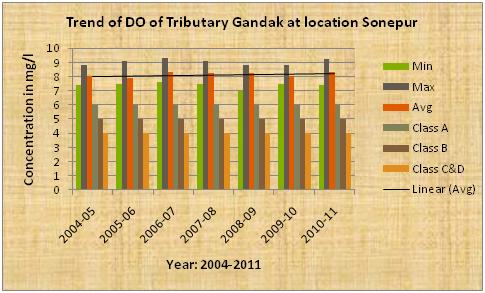
Trend OF BOD
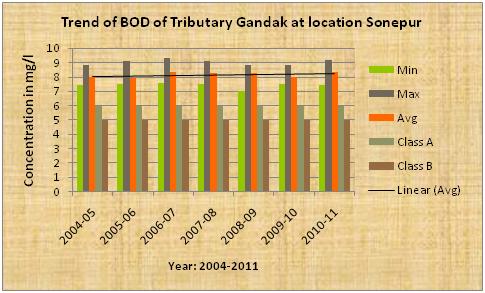
Trend Total Coliform
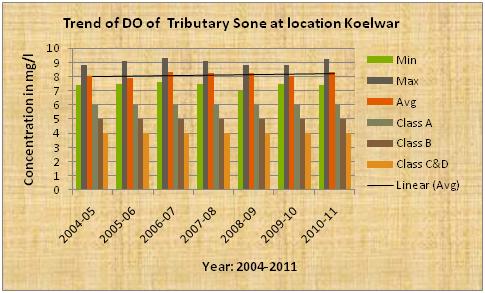
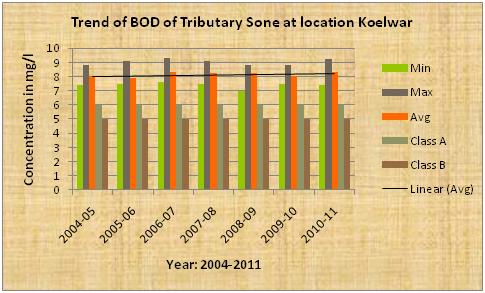
| Sone the tributary of Ganga |
Trend of DO
Trend OF BOD
Trend Total Coliform
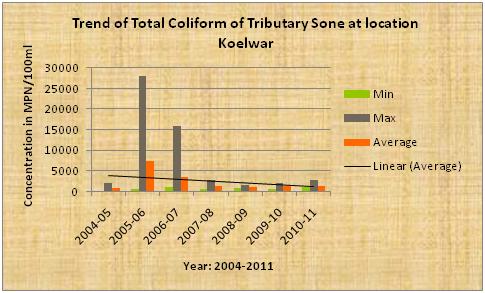
The above diagram indicates that the average pH, dissolve oxygen(DO),BOD of the tributary Sone at confluence of Ganga river stream near Koelwar is more or less constant.
| OBSERVATIONS of PUNPUN, KOSHI & MAHANANDA VATIONS OBSERVATIONS |
|
|
The average pH is vary between 8 to 6.5, DO between 6 to 7 (except Motijheel Lake at Motihari,Which DO trend is marginally low.) and BOD between 2.8 to 3.2.
| Status of Ground water Quality |
|
|
The groundwater quality of state has been assessed based on 45 monitoring stations and samples were analyzed for various physico-chemical and bacteriological parameters by the State Pollution Control Board, because of limited resources. No heavy metals, pesticides and poly-aromatic hydrocarbons were analyzed. The quality of the groundwater varies from place to place with the depth of water table. The groundwater quality has indicated higher concentration of electrical conductivity, total dissolved solids, hardness, calcium, magnesium, chloride, sulphate, nitrate, fluoride, iron, manganese, nickel, lead and cadmium vis-à-vis drinking water quality standards. The ranges of each parameter and their percent violation along with observations on groundwater quality are presented in Table 1 of Annexure I. The distribution of critical groundwater parameters such as TDS and Nitrates of pre and post monsoon seasons has been presented in Figure 3 & 4. No poly-nuclear aromatic hydrocarbons were detected in any of the groundwater samples of the metropolitan city.
|